
Drawing the Map Before You Start Walking
- Centre for Systems Practice
- Mar 30
- 9 min read
Updated: Jul 3

In the social impact sector, we are often rewarded for knowing where we are going.
Proposals have clear destinations. Programmes have milestones. Reports describe progress toward a goal that was defined, often, before we fully understood the territory we were entering. And so we start walking. Quickly. With conviction.
And yet, many of us have also stood in a community meeting or a review call and felt a quiet discomfort. The programme is running. The numbers are reasonable. But the problem is still there.
This piece is about a tool that might help us understand the shape of a problem before we decide how to walk through it.
That tool is systems mapping.
What Is a Systems Map?
A systems map is a drawing of how a problem works. Not how your programme works, not a theory of change, but a drawing of the forces, the people, the decisions, and the relationships that are keeping a problem in place.
Think of a damp patch on the wall of a health centre in Jharkhand. Every week, the staff wipe it down. It comes back. They repaint. It comes back. They file a complaint with the district office. Nothing changes.
A systems map is what happens when someone finally steps back and asks: where is the water coming from? Maybe there is a crack in the roof. Maybe the drainage outside slopes toward the wall. You cannot know until you look at the whole thing together.
The map does not fix the wall. But it tells you where to look.

The Problem We Will Map Together
Let us work through this with a problem that practitioners across India encounter in different forms, in different geographies, across sectors.
Girls are completing primary school but leaving before or during Class 9.
This is not a problem confined to one state. It shows up in Rajasthan, Chhattisgarh, Bihar, Assam. Enrolment in Class 1 has improved significantly over the last decade, and yet something happens at the transition to secondary school. Girls leave. Most do not come back. Toilets have been built, cycles provided, fees waived, awareness campaigns run in hundreds of villages. And still, the dropout continues.
When solutions that should be working are not working, it usually means we are treating a symptom while the source stays untouched.
This is exactly the kind of problem worth mapping.
Step 1: Write the Problem in the Centre. Then Wait.
What changes when you sit with a problem before trying to explain it?
Take a blank page. Write the problem in the middle:
"Girls are leaving school at the transition to Class 9."
Now stop. Before you explain it, before you move toward causes or solutions, just sit with that sentence.
One small discipline helps here. Write the problem as something that is happening, not something that is failing. "Girls are not being educated" implies a deficit in the girl, the family, the community. "Girls are leaving school at a specific transition point" keeps you curious. Something is happening at that juncture. Your job is to understand what.
A colleague working in Assam noticed that dropout spiked in October and November. That observation was possible only because she had named the problem precisely. It told her something: harvest season. Girls were leaving to work in the fields and not returning.
That single detail changed everything her organisation did next.
Step 2: Draw the Reasons Outward
What might be shaping this problem in ways we don't immediately see?
Draw lines outward from the centre. Write one reason at the end of each line. For our problem, the first layer might include: no secondary school in the village; marriage conversations already beginning at home; real safety concerns on the route; a daughter who is needed for household work; a family that genuinely cannot see what comes after school in a village in Barmer or Tonk.
Write all of these. Do not cross any out because your programme already addresses one of them.
The goal at this stage is the honest picture, not the convenient one.

Step 3: Map What the Problem Produces
What does this problem set in motion, beyond the problem itself?
Now draw lines the other way. What does this situation create?
A girl who leaves school early has fewer options, economically, socially, within her own household. When her daughter is born, the conditions that shaped her own decision do not disappear. They begin to shape the next generation. The dropout today is connected to the dropout a generation from now.
This is what makes systems mapping different from simple problem analysis. Consequences can circle back and become causes.
Seeing that loop tells you that working only on immediate causes may slow the problem, but will not break it.
Step 4: Go One Layer Deeper
What begins to emerge when we look beneath the reasons we've already written?
Go back to each first-level cause and ask: what is producing this?
Take "the family does not see what comes after school." In many districts, the local economy genuinely has little to offer educated rural women. Role models matter too. If no woman in the village or the adjoining panchayat has studied, worked, and built something visible, the imagination of what is possible stays narrow. Not because families are closed-minded. Because imagination is shaped by what we can actually see.
Now take "marriage conversations begin around this time." Dowry plays a part in some communities. A younger girl may mean lower costs later. Land inheritance matters too. In most of these geographies, daughters do not inherit agricultural land, which means investing in a daughter's education can feel, from the family's position, like investing in someone else's household. These are not irrational calculations. They are made by people under genuine economic pressure, often carefully.
Draw these second-level causes.
Connect them back. Your map is getting messier. That is correct.

Step 5: Name the People
Who is actually inside this system, and what is each of them trying to do?
A map without people is a map of nothing.
The parents are managing risk in a context where the risks feel very real. The decision to bring a daughter home is rarely made out of ignorance. It is made by someone weighing safety, economics, social pressure, and an uncertain future, often under financial stress. Your map should show you that their behaviour makes sense from where they are standing. That is not the same as agreeing with it. But it is the beginning of knowing how to actually work with them.
The girl herself is almost always present in this system but rarely at its centre. In conversations with girls who have left school across Jharkhand and Chhattisgarh, many had clear ideas about what they wanted - to keep studying. To become nurses or teachers. To run a small business. They did not choose to leave. They were pushed out by forces the map should now be showing you.
Your organisation is in this map too.
Which part of the system are you working on? Does it connect to wherethe loop is turning?

Step 6: Decide What Is Inside and Outside Your Map
What are you choosing to include, and what are you leaving out for now?
Where you draw the boundary determines which solutions become visible to you. Draw it tightly around the school and family, and your interventions will involve parental sensitisation and attendance tracking. Draw it wider to include the local economy, and you begin asking about employment, credit, and what an educated woman can actually do in this district. Draw it wider still, to include inheritance norms and marriage markets, and you are in the territory of change that works across decades, not project cycles.
None of these is wrong. But you should know where yours is.
After drawing the map, write a short separate list: what this map does not include.
That is not a confession of failure. It is a record of what you are not yet working on, and why. It is often as useful as the map itself.
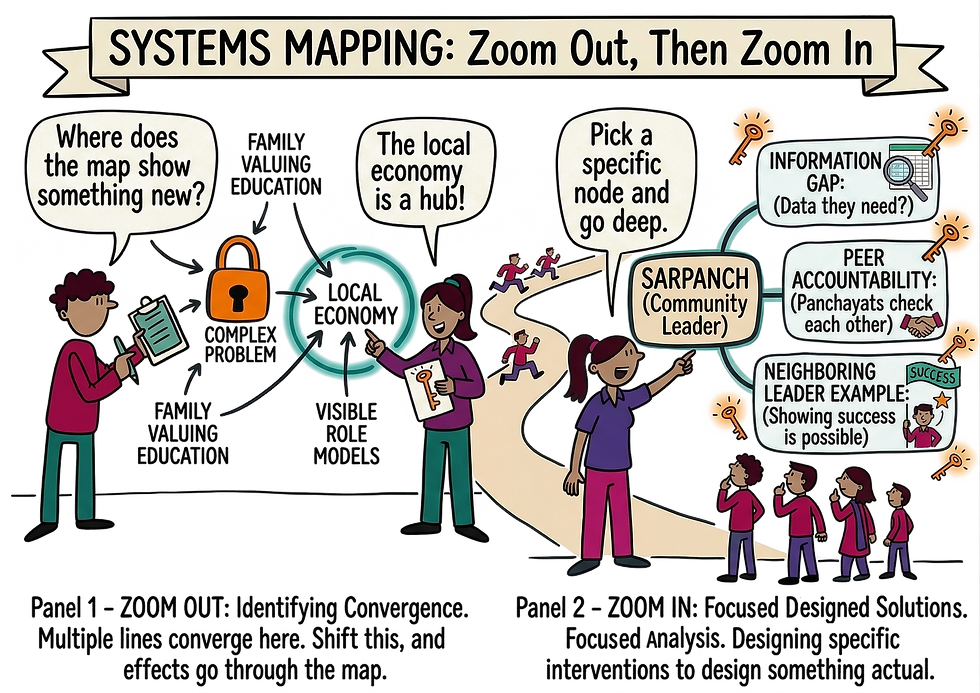
Step 7: Zoom Out, Then Zoom In
Where does the map show you something you could not see before?
Step back and look at the whole. Are there factors that appear more than once? Places where multiple lines converge? In our map, the local economy shows up several times. It shapes whether families value education, what a girl can do after Class 10, and which role models are visible in the community. A programme that shifted the employment landscape for women in this district would send effects through several parts of the map at once. That is worth knowing before you decide where to focus.
Then zoom in. Pick one specific node and go deep. What would actually need to change for the Sarpanch to take dropout seriously? Information they do not have? Peer accountability between panchayats? A neighbouring sarpanch showing it is possible?
Zooming out shows you the shape. Zooming in is how you get to something you can actually design.
When the Map Shows a Vicious Cycle
Sometimes, stepping back from what you have drawn, you see something that stops you.
The consequences of the problem are feeding directly back into its causes. The loop is self-reinforcing, and each turn makes the next more likely. In our dropout map: a girl leaves school, marries early, becomes a mother with limited options. When her daughter is born, the conditions are already being rebuilt around her. The community's imagination of what a girl can become stays narrow because there are no visible examples of it being otherwise.
This is a vicious cycle. It does not need anyone to be malicious to keep turning. It turns because each part of the system is doing exactly what it was set up to do.
Seeing it can feel discouraging. But the map has just done something important. It has shown you why isolated interventions keep disappointing. A toilet at school, without changing the safety situation on the route and the marriage economics at home, leaves the dropout rate almost unchanged. Each intervention is logical. None of them, alone, disrupts the cycle.
The honest question becomes: where do we actually enter this? A single entry point with effects that ripple across the cycle can be more powerful than a sprawling programme addressing five things simultaneously without understanding how they connect.
Write that choice down. State which part of the cycle you are entering, and what you expect to happen if it shifts. That is not bureaucracy. It is how you will know, six months from now, whether the map was right.
What SELCO Foundation Learned About Mapping First
When SELCO Foundation introduced solar-powered agri-processing units for turmeric farmers, the intention was sound. Better machines and reliable energy would help farmers add value to their produce and earn more. The technology worked.
But over time it became clear that the technology was only one part of a much larger system. Farmers were familiar with selling raw turmeric. Selling processed powder required new market connections, different buyers, and demand that had to be built. Some units were underused. Break-even timelines were longer than expected.
The learning was not that the intention was wrong. The map had simply been drawn too narrowly. What worked in one livelihood context required a deeper understanding of the ecosystem, the market dynamics, and the incentive structures when applied to another.


Source: "Grinding to a Halt: The Flaws in Solar-Powered Agri-processing Solutions," SELCO Foundation, Impact Failure Platform, 2025.
A Way to Start Today
You do not need a workshop or a whiteboard. You need twenty minutes and a page.
Write the problem in the centre. Ask: what are the three most important reasons this problem exists? What does it produce? Who are the five people most involved, not organisations but people, and what does each of them want or fear? What have you left out?
Then look at the whole thing. Is there anything that appears more than once? A place where, if something changed, multiple things would shift?
That is your first map. It will not be perfect. But if it is honest, it will already show you something you did not see when you started. The test of a good map is not whether it is complete. It is whether it changes the questions you ask next.
Closing Questions
As you continue your work, perhaps these can sit alongside you:
Where might your current map be drawn too narrowly?
Who is in the system you are working on that is not yet in your programme?
What would change if understanding the problem were treated as ongoing, not just an opening step?
Staying with the problem does not make us less effective. It makes us more honest. And in the kind of work we are doing, honesty might be the most important tool we have.
Try It for Yourself
Reading about systems mapping is one thing. Doing it with a real problem you are sitting with is something else entirely.
We have put together a simple worksheet to go alongside this piece. It gives you space to write your central issue, map the direct causes around it, and then go one layer deeper to the causes of those causes. That is where the map usually starts to surprise you.
Pick a problem you are currently working on. Not a hypothetical. Something you are actually in the middle of. Fill in what you know, note what you are uncertain about, and see what the shape of it looks like on paper.
It does not need to be complete, it just needs to be honest.
And if something in the worksheet raises a question, or if you want to think through your map with us, write to us at info@centreforsystemspractice.org. We would love to hear what you are working on.

The Centre for Systems Practice is a SELCO Foundation initiative. If this piece was useful, our newsletter goes out every month with one piece of practical thinking from the field.


Comments